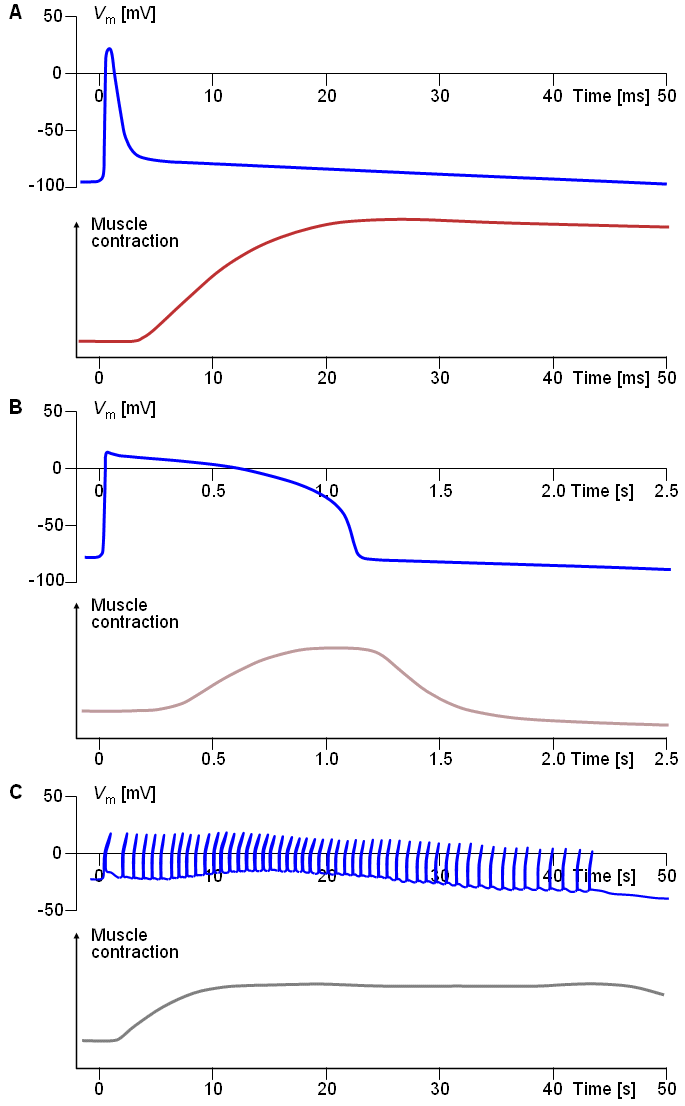
Fig. 6.5. Electric and mechanical activity in
 (A) frog sartorius muscle cell, (A) frog sartorius muscle cell,
 (B) frog cardiac muscle cell, and (B) frog cardiac muscle cell, and
 (C) rat uterus wall smooth muscle cell. (C) rat uterus wall smooth muscle cell.In each section the upper curve shows the transmembrane voltage behavior, whereas the lower one describes the mechanical contraction associated with it. |