14.1 THE BRAIN AS A BIOMAGNETIC GENERATOR
PRECONDITIONS:
SOURCE: Distribution of impressed current source elements  i (volume source)
CONDUCTOR: Finite, inhomogeneous with spherical symmetry
The bioelectric impressed current density  i associated with brain activity produces an electric and a magnetic field. The magnetic field is given by Equation 12.6.
  | (14.01) |
This signal is called the magnetoencephalogram (MEG). David Cohen was the first to succeed in detecting the magnetic alpha rhythm. In this first successful experiment he used an induction coil magnetometer in a magnetically shielded room (Cohen, 1968). David Cohen was also the first scientist to detect the MEG with a point contact rf-SQUID in 1970 (Cohen, 1972). The amplitude of the MEG is less than 0.5 picotesla (pT) and its frequency range is similar to that of the EEG. Because the source of the magnetic field as well as that of the electric field of the brain is the impressed current
The sensitivity distribution of a planar gradiometer is illustrated in Figure 14.4. From the two adjoining coils, the one on the left is wound in a "positive" direction, and the one on the right in a correspondingly "negative" direction (the latter is drawn with a dashed line). This construction is called the planar gradiometer. This measurement situation may also be achieved by subtracting the measurement signals from two adjoining magnetometers or (axial) gradiometers.
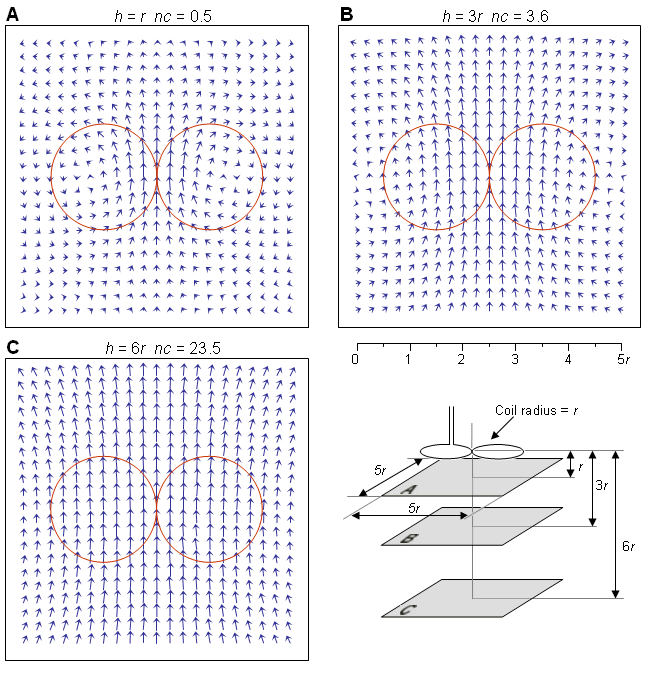
Fig. 14.4. Sensitivity distribution of a planar gradiometer having the radius r. The sensitivity distribution is given on three parallel planes at distances (A) 1r, (B) 3r, and (C) 6r. The lengths of the vectors in A, B, and C are multiplied by the normalization coefficients nc.
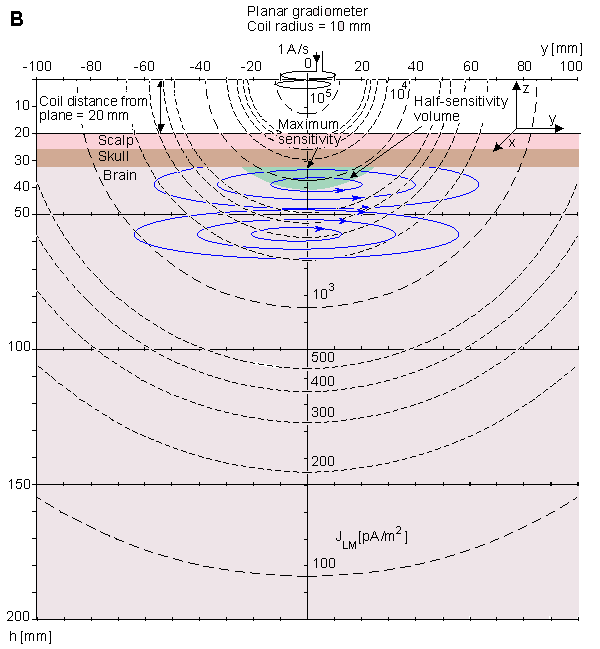
Fig. 14.5. Isosensitivity lines (dashed lines) and half-sensitivity volume for a planar gradiometer calculated for a conducting half-space. Lead field current flow lines are drawn with thin solid lines. They are not accurate solutions.
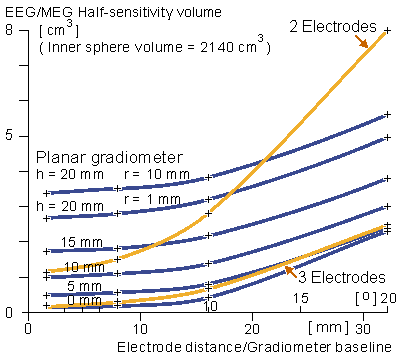
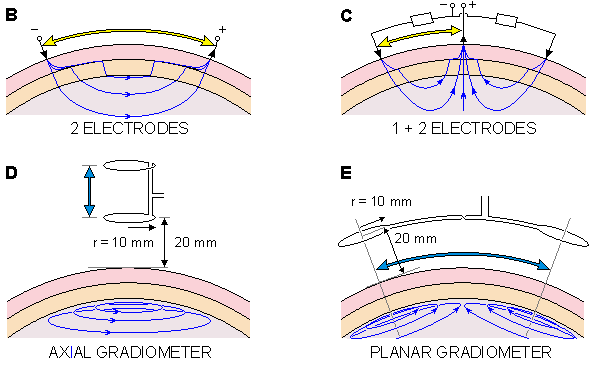
Fig. 14.6. (A) Half-sensitivity volumes for two- and three-electrode electric leads (yellow lines), planar gradiometers of 10 mm coil radius (blue line) and 1 mm coil radius (dashed blue lines) as a function of electrode distance/gradiometer baseline. (The half-sensitivity volume of the axial gradiometer falls outside the figure.) The measurement situations are shown (B) for the two-electrode and (C) for the three-electrode electric leads, (D) for the axial gradiometer and (E) for the planar gradiometers. The head model is the inhomogeneous spherical model of Rush and Driscoll. (Suihko and Malmivuo, 1993).
Cohen D (1968): Magnetoencephalography, evidence of magnetic fields produced by alpha-rhythm currents. Science 161: 784-6.
Cohen D (1972): Magnetoencephalography: Detection of brain's electric activity with a superconducting magnetometer. Science 175:(4022) 664-6.
Eaton H (1992): Electric field induced in spherical conductor from arbitrary coils: Application to magnetic stimulation and MEG. Med. & Biol. Eng. & Comput. 30:(July) 433-40.
Hoenig HE, Daalmans G, Folberth W, Reichenberger H, Schneider S, Seifert H (1989): Biomagnetic multichannel system with integrated squids and first order gradiometers operating in a shielded room. Cryogenics 29:(8) 809-13.
Kajola M, Ahlfors S, Ehnholm GJ, Hällström J, Hämäläinen MS, Ilmoniemi RJ, Kiviranta M, Knuutila J, Lounasmaa OV, Tesche CD, Vilkman V (1990): A 24-channel magnetometer for brain research. In Advances in Biomagnetism, ed. SJ Williamson, L Kaufman, pp. 673-6, Plenum Press, New York.
Knuutila J, Ahlfors S, Ahonen A, Hällström J, Kajola M, Lounasmaa OV, Tesche C, Vilkman V (1987): A large-area low-noise seven-channel dc-squid magnetometer for brain research. Rev. Sci. Instrum. 58: 2145-56.
Knuutila J, Ahonen A, Hämäläinen M, Kajola M, Lounasmaa OV, Simola J, Tesche C, Vilkman V (1991): Design of a 122-channel neuromagnetometer covering the whole head. In Abst. 8th Internat. Conf. Biomagnetism, ed. M Hoke, pp. 109-10, Westfälische Wilhelms-Universität, Münster.
Malmivuo JA (1980): Distribution of MEG detector sensitivity: An application of reciprocity. Med. & Biol. Eng. & Comput. 18:(3) 365-70.
Malmivuo JA, Puikkonen J (1987): Sensitivity distribution of multichannel MEG detectors. In Abst. 6th Internat. Conf. Biomagnetism, Tokyo, 27-30 August, ed. K Atsumi, M Kotani, S Ueno, T Katila, SJ Williamson, pp. 112-3, Tokyo Denki University Press, Tokyo.
Malmivuo JA, Puikkonen J (1988): Qualitative properties of the sensitivity distribution of planar gradiometers. Tampere Univ. Techn., Inst. Biomed. Eng., Reports 2:(1) pp. 35.
Rush S, Driscoll DA (1969): EEG-electrode sensitivity - An application of reciprocity. IEEE Trans. Biomed. Eng. BME-16:(1) 15-22.
Hoke M, Grandori F, Romani G-L (eds.) (1990): Auditory Evoked Magnetic Fields and Electric Potentials, 362 pp. S. Karger, Basel.
Regan D (1989): Human Brain. Electrophysiology, Evoked Potentials and Evoked Magnetic Fields in Science and Medicine, 672 pp. Elsevier, Amsterdam.
Suihko V, Malmivuo J (1993): Sensitivity distributions of EEG and MEG measurements. In EEG and MEG Signal Analysis and Interpretation, Proceedings of the Second Ragnar Granit Symposium, ed. J Hyttinen, J Malmivuo, pp. 11-20, Tampere University of Technology, Ragnar Granit Institute, Tampere.
Swithenby SJ (1987): Biomagnetism and the biomagnetic inverse problem. Phys. Med. Biol. MJ Day (ed.): The Biomagnetic Inverse Problem, 32:(1) 146. (Papers from a conference at the Open University, April 1986).
Uchikawa Y, Matsumura F, Kobayashi K, Kotani M (1993): Discrimination and identification of multiple sources of the magnetoencephalogram using a three-dimensional second-order gradiometer. J. Jpn. Biomagn. Bioelectromagn. Soc. 6: 12-5.
 i, these fields have a very similar appearance.
 It should be noted again that the first term on the right side of Equation 12.6 represents the contribution of the bioelectric sources, whereas the second term represents the contribution of the inhomogeneities of the volume conductor. The reader can easily verify this fact by realizing that in a homogeneous conductor, the conductivities are equal on both sides of each interface of the piecewise homogeneous region described in Equation 12.6, and the difference (s"j - s'j) is equal to zero.
 In the cylindrically symmetric situation, the lead field flow lines do not cross the interfaces of the homogeneous regions in the piecewise homogeneous volume conductor and are therefore not affected by the inhomogeneities. (The spherically symmetric situation is a special case of cylindrical symmetry.) In the mathematical formula this is indicated by the fact that the second expression on the right side of Equation 12.6 does not contribute to the lead voltage VLM. The reason for that is that in evaluating Equation 12.12 we must form the dot product of the secondary source (which is in the radial direction) with the lead field (which is in the circumferential direction) and the result is equal to zero.
 The source of the MEG signal, as well as that of the EEG signal, is the electric activity of the brain. But as discussed in Chapter 12, the sensitivity distribution of the magnetic measurements differs essentially from the electric because the lead field current densities
  LM and
  LE have an essentially different form.
 As discussed in Chapter 12, if the electrodes of an electric lead are placed on a spherical volume conductor (the head) and lie on the axis of symmetry of a magnetic lead, the electric and magnetic lead fields are normal to each other everywhere in the volume conductor, (Malmivuo, 1980; see also Figure 12.2). In this special case, the MEG consequently allows detection of source components that are not sensed with the EEG. It is important to note that since the sensitivity of the magnetic leads are directed tangentially, the poor conductivity of the skull has no effect on the shape of the lead field.
14.2 SENSITIVITY DISTRIBUTION OF MEG-LEADS
14.2.1 Sensitivity Calculation Method
In electroencephalography the head is modeled with concentric spheres. As discussed above, this model is valid and important also in magnetoencephalography. Because of the low signal level of MEG, the measurements are usually made as close to the head as possible. Since sensitivity decreases rapidly with distance, and since the detector coil radius is small compared to the dimensions of the head, the head can be successfully modeled as a half-space. This holds also for multichannel MEG-detectors, because the detectors are usually placed on a spherical surface, concentric with the head.
 There are two different ways to construct the detector coils. One approach is to construct the detector channels from first- or second-order gradiometers, where the two or three gradiometer coils are located concentrically with a baseline on the order of centimeters. The other approach utilizes planar gradiometers; two adjoining detector coils, located on the same plane, are connected together with the shape of a figure 8.
 As explained in Section 12.11 the sensitivity distribution of MEG leads is calculated with a half-space model. In multichannel cases the total sensitivity is easily obtained by superimposing the sensitivities of each channel. The sensitivity distributions are illustrated on planes, oriented parallel to the outer surface of the head, and located at different distances, as illustrated in Figure 14.1. The detector coil is oriented parallel to the surface and has a radius r. It is assumed that all the coils are located in the same plane. This means that in the single-coil case the detector is a single-coil magnetometer. In the double-coil case the detector corresponds to a first-order planar gradiometer.
 The lead fields are illustrated as vector fields (Malmivuo and Puikkonen, 1987, 1988). The illustrations are normalized so that the distances of the planes are 1r, 3r, and 6r, where r is the radius of the magnetometer coil(s). (The most distant of these planes (6r) is relevant when evaluating the lead fields for small MEG detector coils and the closest one (1r) when applying magnetic stimulation with a large coil.) The lead field is shown on each plane within a square having a side dimension of 6r. In each figure the vector fields are normalized so that the maximum vector has approximately unity magnitude. The normalization coefficient nc is given in each figure in relation to Figure 14.2A, which illustrates the lead field of a single coil on a plane at the distance of 1r from the coil.
 The lead fields are illustrated both with lead vector fields and with isosensitivity lines. In the isosensitivity line illustrations a half-sensitivity volume is also shown. This concept describes the space where the sensitivity is equal or larger than one half of the maximum sensitivity. The smaller the half-sensitivity volume, the more accurately it is possible to detect signals from different areas of the volume source.
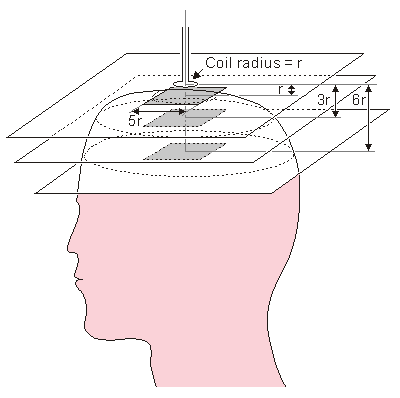
Fig. 14.1. Location of the planes for evaluating the sensitivity distribution of MEG lead systems.
14.2.2 Single-Coil Magnetometer
PRECONDITIONS:
SOURCE: Single-coil magnetometer
CONDUCTOR: Finite, inhomogeneous with spherical symmetry along the magnetometer axis
 The sensitivity distribution of a single-coil magnetometer is illustrated in Figure 14.2. The sensitivity distribution has the form of concentric circles throughout the spherical volume conductor. At the distance of 1r the magnitude of the sensitivity increases as a function of the distance from the axis to a peak at about r. On the two more distant planes the maximum sensitivity as a function of the radius is not achieved within the area of the illustration.
 It is interesting to compare Figures 14.2 and 12.15. As noted in Chapter 12, these figures represent the same sensitivity distribution illustrated with different methods. The reader will recognize, that the curves in Figure 12.15 correspond to the variation of the length of the vectors in Figure 14.2, and thus they represent the lead field as a function of the radius.
 As noted before, the length of the vectors in Figures 14.2B and 14.2C are multiplied by a normalization coefficient nc so that in each figure the maximum length of the vectors is approximately the same.
 Figures 14.3.A and B illustrate the sensitivity distribution with isosensitivity lines for single coil magnetometers with 10 mm and 5 mm radii, respectively. The isosensitivity lines join the points in the space where the lead field current density has the same value. The isosensitivity lines are illustrated with dashed lines. The figure also illustrates some lead field current flow lines with thin solid lines. Because the lead field of a single coil magnetometer exhibits cylindrical symmetry, the spherical head model can be directly superimposed to this figure. It is supposed that the minimum distance from the coil to the scalp is 20 mm. The sensitivity distribution for a coil with 50 mm radius is presented later in connection with magnetic stimulation in Figure 24.4.
 The areas of the maximum sensitivity and the half-sensitivity volume are marked with shading. The location of the maximum sensitivity region and the size of the half-sensitivity volume depend on the measurement distance and the coil radius, though this relationship is not very strong.
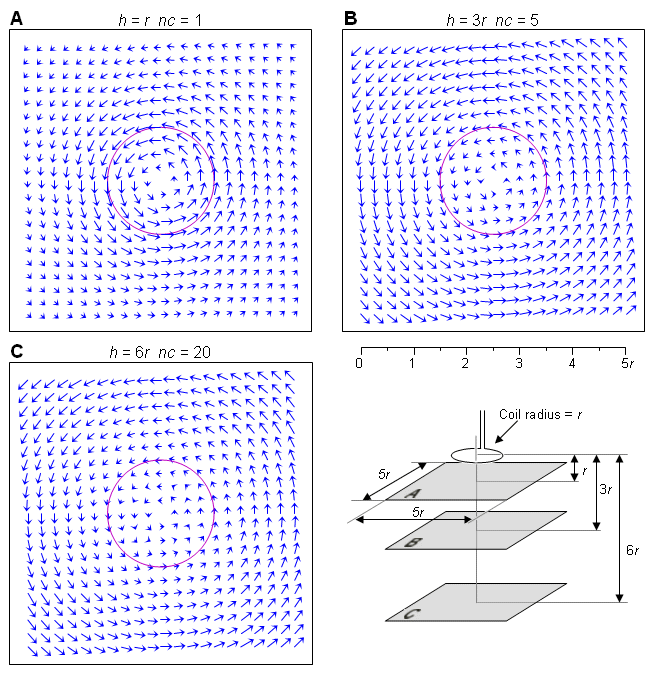
Fig. 14.2. Sensitivity distribution of a single-coil magnetometer having the radius r. The sensitivity distribution is given on three parallel planes at distances (A) 1r, (B) 3r, and (C) 6r. Note that the lengths of the vectors in B and C are multiplied by the normalization coefficients nc.
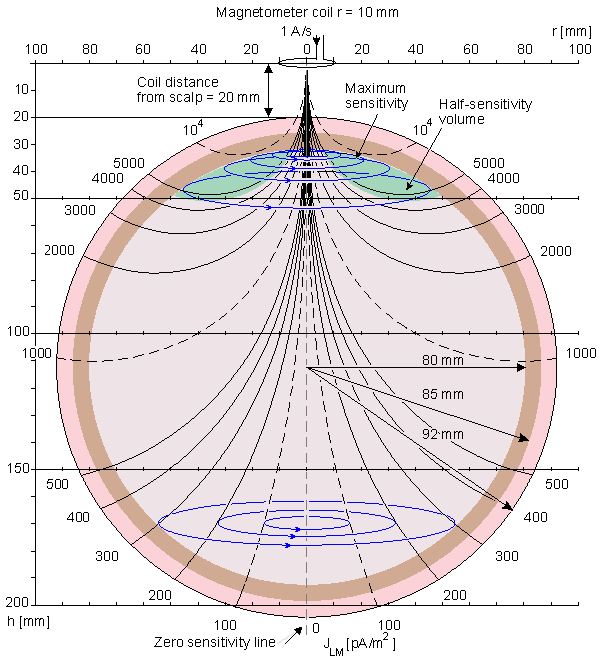
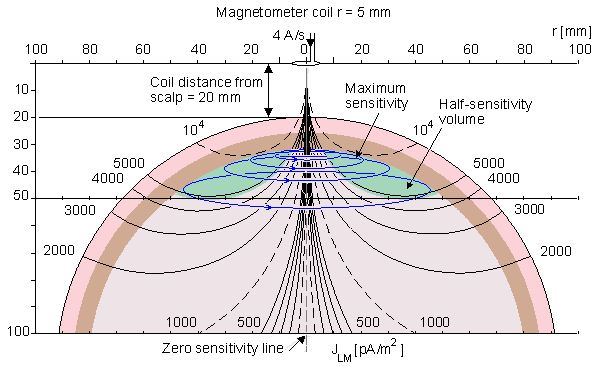
Fig. 14.3. Isosensitivity lines in MEG measurement in a spherical head model with a single coil magnetometer having the radii of A) 10 mm and B) 5 mm. The sensitivity is everywhere oriented tangential to the symmetry axis which is the line of zero sensitivity. Within the brain area the maximum sensitivity is located at the surface of the brain and it is indicated with shading.
14.2.3 Planar Gradiometer
PRECONDITIONS:
SOURCE: Planar gradiometer
CONDUCTOR: Conducting half-space
 The sensitivity distribution of a planar gradiometer is no longer mainly circular but has a linear form within the target region. The more distant the measurement plane is from the detector coil, the more uniform is the sensitivity distribution. The magnitude of the sensitivity of a planar gradiometer decreases faster as a function of distance than does that of a single-coil magnetometer. Therefore, the detected signal originates from sources located mainly in the region closest to the detector.
 It should be noted that the sensitivity distribution of a bipolar electric measurement is also linear, as was shown in Figure 13.4. Thus the sensitivity distribution of a planar gradiometer MEG is very similar to that of bipolar EEG measurement.
 The isosensitivity lines of a planar gradiometer are illustrated in Figure 14.5. Because this magnetometer arrangement and the lead field it produces are not cylindrically symmetric, the results are accurate only in an infinite, homogeneous volume conductor or in a homogeneous half-space. Therefore a spherical head model cannot be superimposed to these illustrations and a conducting half-space model is used. The distance of the half-space is selected the same as that of the spherical head model directly under the coil. Figure 14.5.A illustrates the isosensitivity lines in the xz-plane, which is the plane including the axes of the coils. This plane includes also the zero sensitivity line. It approaches a line which makes a 35.27° angle with respect to the z-axis. Figure 14.5.B illustrates the isosensitivity lines in the yz-plane. In this plane the isosensitivity lines are concentric circles at distances large compared to the coil dimensions. At distance of 10r and 100r they differ within 1% and 0.1% from a circle, respectively. The thin solid lines illustrate the lead field current flow lines. These are not accurate solutions.
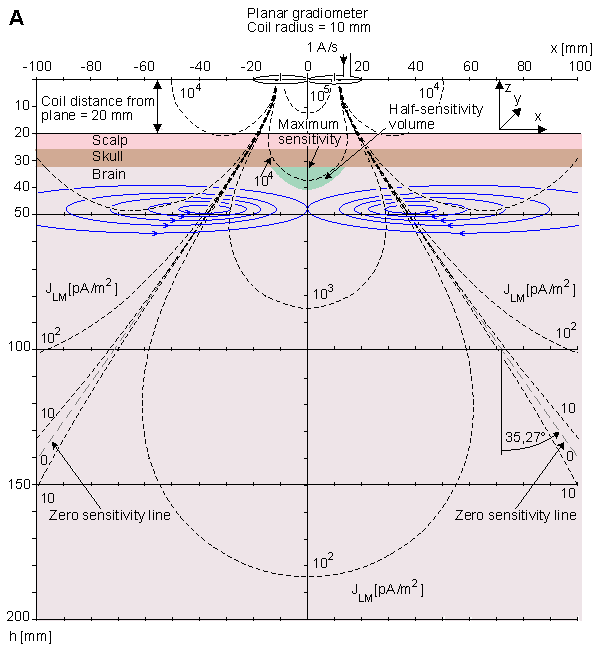
 A) In the xz-plane the zero sensitivity line approaches asymptotically the line which makes a 35.27° angle with respect to the z-axis.
 B) In the yz-plane the isosensitivity lines approach concentric circles at long distances concentric circles.
14.3 COMPARISON OF THE EEG AND MEG HALF-SENSITIVITY VOLUMES
As discussed before, the evaluation of the half-sensitivity volume is a figure-of-merit describing the lead system's ability to concentrate its measurement sensitivity. Suihko and Malmivuo (1993) compared the half-sensitivity volumes (in the brain region) for two- and three-electrode electric leads and for axial and planar gradiometer magnetic leads as a function of electrode distance/gradiometer baseline. The electric and magnetic leads are those described in Figure 13.4 and in Figures 14.3 and 14.5, respectively. In addition to those a three-electrode lead was evaluated where all electrodes are equidistant, the lateral ones being interconnected to serve as the other terminal. The head model is the spherical model of Rush and Driscoll (1969). The results are illustrated in Figure 14.6.
 All these leads have, as expected, minimum half-sensitivity volumes with small electrode distances/gradiometer baselines. The electric leads have the smallest values being superior to the magnetic leads. The half sensitivity volume of the three-electrode lead at 1° separation is 0.2 cm³ and that of the two-electrode lead is 1.2 cm³. The half-sensitivity volume of the two-electrode lead is only 30% of that of the planar gradiometer (3.4 cm³) while that of the axial gradiometer is as large as 21.8 cm³. The gradiometer results are calculated at 20 mm coil distance from scalp.
 The 20 mm coil distance and 10 mm coil radius are realistic for the helmet-like whole head MEG-detector. There exist, however, MEG devices for recording at a limited region where the coil distance and the coil radius are of the order of 1 mm. Therefore it is illustrated in Figure 14.6 the half-sensitivity volume for planar gradiometers with 1 mm coil radius at 0 - 20 mm recording distance. These curves show, that when the recording distance is about 12 mm such a planar gradiometer has about the same half-sensitivity volume as the two-electrode EEG.
 Another aspect in the comparison of the electric and magnetic leads is the form of the sensitivity distribution. With short electrode distance/gradiometer baseline the lead fields of the two-electrode and planar gradiometer leads are mainly tangential to the head, as illustrated in Figure 13.4 (at 20° and 40° electrode distances) and in Figure 14.4, respectively. The three-electrode lead has primarily a radial sensitivity distribution (not illustrated in this book) and the axial gradiometer has a sensitivity distribution which is that of a vortex (tangential to the symmetry axis of the gradiometer), see Figures 14.2 and 14.3.
 In summary, under practical measurement conditions the differences between the two-electrode EEG lead and the planar gradiometer MEG lead in the size of the half-sensitivity volumes and the form of the sensitivity distributions are very small. This result is important because it is generally believed that the high resistivity of the skull forces the electric leads to record the signal from a larger region. However, this is not the case but the two-electrode EEG and the planar gradiometer MEG are about equally effective in concentrating their sensitivities while the three-electrode electric lead is still more effective.
14.4 SUMMARY
In this chapter the sensitivity distribution was calculated for single and multichannel MEG detectors. The method used in this chapter is valid under cylindrically symmetric conditions. This is a relevant approximation in practical MEG measurement situations. Other methods exist for calculating the sensitivity distribution of MEG detectors which give accurate results in situations having less symmetry ;they are therefore more complicated and, unfortunately, less illustrative (Eaton, 1992; Esselle and Stuchly, 1992).
 If two adjoining coils are connected together either directly or by summing up the detected signals so that the coils detect the magnetic field in different directions, the combination of these coils form a planar gradiometer. The sensitivity distribution of such a construction is no longer circular (vortex) but linear and resembles very much that of an electric lead. The maximum of the sensitivity and, therefore, the most probable location of the signal source for such a construction are located directly under the coils (on the symmetry axis).
 There are various multichannel MEG detectors. The number of channels has increased from 7 (Knuutila et al., 1987) to 24 (Kajola et al., 1990) and 32 (Hoenig et al., 1989) to 124 (Knuutila et al., 1991). The detector coils are usually located on a spherical surface concentric with the head. On this surface the coils are usually placed as close to each other as possible, forming a honeycomb-like pattern. In the 124-channel construction the dewar covers the head in a helmetlike construction.
 Though the magnetic field is a vector quantity (unlike the electric potential field which is a scalar quantity) the majority of the MEG detectors record only one component of the magnetic field. There exist, however, some works where all the three components of the magnetic field are recorded. Early on, in his pioneering work, David Cohen illustrated the vectorial form of the magnetic field of the brain (Cohen, 1972). As an example of the modern MEG research with a vector gradiometer the work of Yoshinori Uchikawa and his colleagues should be mentioned (Uchikawa et al., 1992; 1993).
 In MEG we are mainly interested in the electric activity at the surface of the brain, the cortex. Therefore unipolar measurements are relevant when measuring the MEG. As it will be discussed later in Chapter 20, in MCG we are interested in the electric activity of the whole cardiac muscle. Therefore bipolar (symmetric) measurements are more relevant in measuring the MCG.
REFERENCES
REFERENCES BOOKS


