


25
Impedance Plethysmography
 enko and coworkers (1973). This method has, however, hardly been used outside the Soviet Union.
 Determination of the cardiac stroke volume is an area in which accurate, easily applied, noninvasive methods are needed. Impedance cardiography is easy to apply, noninvasive, and also cheap; however, it has serious methodological limitations, which are discussed below. We also provide a brief overview of other applications of impedance plethysmography.
The magnetic method corresponding to electric impedance plethysmography is called magnetic susceptibility plethysmography. This method may be used for monitoring blood volume changes in the thorax. Most living tissues are diamagnetic since water is their major constituent. If a strong magnetic field is applied to the region of the thorax, the movements of the heart, blood, and chest wall during the heart cycle cause variations in magnetic flux. Thus it is possible to monitor these variations with a SQUID magnetometer during the heart cycle (Wikswo, 1975; Maniewski et al., 1988). Currently, magnetic susceptibility plethysmography does not have clinical applications and, therefore, this method is not discussed in detail in this book.
Otto H. Schmitt first suggested that the concept of lead field could be used in connection with impedance plethysmography. David Geselowitz (1971) mathematically proved this relationship between the measured impedance changes and the changes in conductivity within a volume conductor. John Lehr (1972) later presented another proof of this relationship. In the following we give the result of Geselowitz using the terminology and sign convention of this book. (Note that Geselowitz (1971) defined the lead fields as the electric fields per reciprocal current and we define them as the current fields per unit reciprocal current. These are, of course, directly related by Ohm's law.)
Determination of the cardiac stroke volume is an area in which accurate, easily applied, noninvasive methods are needed. Impedance cardiography is easy to apply, noninvasive, and also cheap; however, it has serious methodological limitations, which are discussed below. We also provide a brief overview of other applications of impedance plethysmography.
The magnetic method corresponding to electric impedance plethysmography is called magnetic susceptibility plethysmography. This method may be used for monitoring blood volume changes in the thorax. Most living tissues are diamagnetic since water is their major constituent. If a strong magnetic field is applied to the region of the thorax, the movements of the heart, blood, and chest wall during the heart cycle cause variations in magnetic flux. Thus it is possible to monitor these variations with a SQUID magnetometer during the heart cycle (Wikswo, 1975; Maniewski et al., 1988). Currently, magnetic susceptibility plethysmography does not have clinical applications and, therefore, this method is not discussed in detail in this book.
Otto H. Schmitt first suggested that the concept of lead field could be used in connection with impedance plethysmography. David Geselowitz (1971) mathematically proved this relationship between the measured impedance changes and the changes in conductivity within a volume conductor. John Lehr (1972) later presented another proof of this relationship. In the following we give the result of Geselowitz using the terminology and sign convention of this book. (Note that Geselowitz (1971) defined the lead fields as the electric fields per reciprocal current and we define them as the current fields per unit reciprocal current. These are, of course, directly related by Ohm's law.)
  | (25.1) |
| where | DZ | = impedance change [W/mł] |
| t0, t1 | = time instants | |
| Ds | = conductivity change between the two time instants [S/m = 1/W·m] | |
 LE LE | = lead field of the voltage measurement electrodes for unit reciprocal current [1/m2] | |
| LI | = lead field of the current feeding electrodes for unit current [1/m2] | |
| v | = volume [m3] |
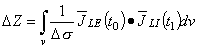
where all variables are evaluated at t0. Equation 25.2 describes how the macroscopic resistivity Z (impedance per unit volume) is derived from the spatial distribution of conductivity s weighted by the dot product of the lead fields of the current and voltage electrodes. Note the similarity between Equation 25.2 and the fundamental equation of the lead field theory, Equation 11.30 (or 11.52), which describes the electric signal in the lead produced by a volume source formed by a distribution of the impressed current
The right-hand side of Equation 25.4 is a constant where one recognizes the equation to be that of a circle whose center is at Im = 0, Re = (R 0 - R
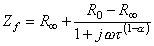
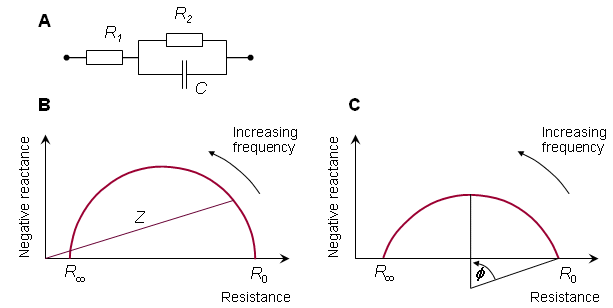
In the corresponding Cole-Cole plot, shown in Figure 25.1C, the depression angle is f = (1 - a)p/2. Figure 25.2 shows the depression of the semicircle in the Cole-Cole plots for the transverse and longitudinal impedances of skeletal muscle as measured by Epstein and Foster (1983).
In Equation 25.1, the region v consists of an inhomogeneous volume conductor whose conductivity (as a function of position) at time t0 is s(t0). At t1, this has changed to s(t1), and it is this change (t1) - (t0) = Ds which is responsible for the measured impedance change DZ. Thus Equation 25.1 describes how the changes in volume conductor conductivity are converted into the impedance change evaluated from a measured voltage (at the voltage electrode pair) divided by applied current (at the current electrode pair). Note that the 4-electrode impedance method underlies Equation 25.1.
A special case of Equation 25.1 is one where we consider s(t1) = es(t0), where e is very small:
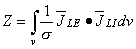
(25.2) i. In these equations the corresponding variables are the measured signals: VLE and Z (= measured voltage per applied current), the distributions of sensitivity: LE in both of them, as well as the source distributions: i and LI.
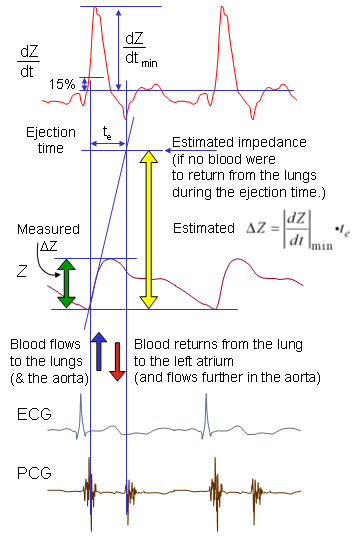
If the introduction of the current is done with the same electrodes as the voltage measurement is made, the sensitivity distribution, that is the lead field LE is the same as the distribution of the applied current LI. This technique is, however, seldom used because of the artifact due to the electrode impedance. If the current-feeding electrodes are different from those of the voltage measurement electrodes, the sensitivity distribution is the dot product of the lead fields of the voltage electrodes LE and the current electrodes LI. Thus, any previous discussion in this book on the electric and magnetic lead fields in general (Chapters 11 and 12), in the head (Chapters 13 and 14) or in the thorax (Chapters 15 ... 18 and 20) may readily be applied to impedance plethysmography. Just as in the study of electrocardiography, one can design electrode systems for impedance measurement to give special emphasis to particular regions (the aorta, the ventricles, etc.). One can even have situations where the dot product is negative in a particular region so that if the conductivity increases in that region, the impedance Z will also increase. Some examples can be found in Plonsey and Collin (1977) and Penney (1986).
While Equation 25.1 is a suitable theoretical basis for impedance plethysmography, we are still left with considerable uncertainty how varies throughout the heart and torso or in what way the circulation modifies the thorax structure and conductivity as a function of time throughout the cardiac cycle. Further research is required to develop a physiologically adequate circulation model. Note, however, that Equation 25.1 may be more readily applied over a longer time frame (t1 - t0) to, say, the growth of a localized tumor in the thorax (other regions remaining the same).
25.2.2 Tissue Impedance
The physical quantity measured in impedance plethysmography (and imaged in impedance tomography) is tissue impedance. (The impedance of various tissues was discussed in Section 7.4.) From Table 7.3 it can be seen that the resistivity of body organs varies about 100-fold from about 1.6 Wm in blood to about 170 Wm in bone. Within the soft tissues the variability is about 10-fold, with about 20 Wm in the lung and in fat.
In measuring bioelectric sources the reactive component of tissue impedance is not important because the frequency range is under 1 kHz. Actually, in Section 7.2.4 it was shown that it can be omitted with the assumption of quasistationarity. In impedance plethysmography (and tomography) the frequency dependence of tissue impedance is a factor which can be utilized for increasing the selectivity of the system. Because the impedance of different tissues has different reactive components, the impedance may be measured with applied currents at different frequencies (Lozano, Rosell, and Pallás-Areny, 1990). The frequencies may be selected so that the separation of certain tissues is maximized. With appropriate filtering the measurement may be done simultaneously with different frequencies in order to save measurement time.
A useful method for illustrating the behavior of tissue impedance as a function of frequency is the Cole-Cole plot (Cole and Cole, 1941). In this presentation, real component R is plotted versus imaginary component X in the complex series impedance (R + jX) with the frequency as a parameter. Figure 25.1B shows the Cole-Cole plot of a three-element impedance with a single time constant, as shown in Figure 25.1A. The Cole-Cole plot obeys the following equation:
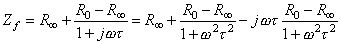
(25.3)
where Zf = impedance (as a function of frequency f ) R0 = resistance at f = 0 R 
= resistance at f = 
t = time constant (R2C) The Cole-Cole plot is a semicircle with radius (R 0 - R )/2 which intercepts the real axis at R 0 and R, a conclusion that can be verified by noting that the real (Re) and imaginary (Im) parts of Equation 25.3 satisfy
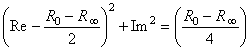
(25.4) )/2 with a radius of (R 0 - R )/2, as stated. In the three-element circuit of Figure 25.1A, R0 = R1 + R2, R = R 1 , and t = R2C.
In practice, the center of the semicircle is not necessarily on the real axis, but is located beneath it. The equation representing practical measurements may be described by Equation 25.5 (Schwan, 1957):
(25.5) The reactive component of human blood has been studied, for example, by Tanaka et al. (1970) and Zhao (1992). The reactive component of tissue impedance seems to have an important role in impedance plethysmography, as will be discussed later in this Chapter in connection with determining body composition..
(B) Cole-Cole plot for impedance with a single time constant.
(C) The depressed Cole-Cole plot.
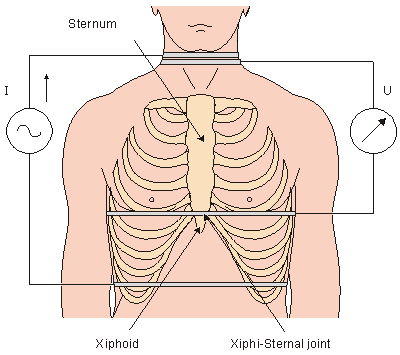
(B) longitudinal impedances of skeletal muscle.(Redrawn from Epstein and Foster, 1983.)The impedance of the thorax is measured longitudinally by four band electrodes, shown in Figure 25.3. In the physical arrangement of the outer pair, one electrode is placed around the abdomen and the other around the upper part of the neck. For the inner electrode pair, one electrode is placed around the thorax at the level of the joint between the xiphoid and the sternum, called the xiphisternal joint, and the other around the lower part of the neck. In recent studies of impedance cardiography, the band electrodes are often replaced with normal ECG-electrodes.
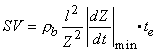
Figure 25.4 presents a typical thorax impedance curve (Z), its first time derivative (dZ/dt), and the simultaneous electrocardiogram (ECG), and phonocardiogram (PCG) curves. The impedance curve is usually shown so that a decrease in impedance results in an increase in the y-axis magnitude. This sign convention describes the changing admittance; for example a decreasing impedance could arise from an increasing amount of low impedance blood in the thorax. The polarity of the first derivative curve is consistent with the impedance curve..
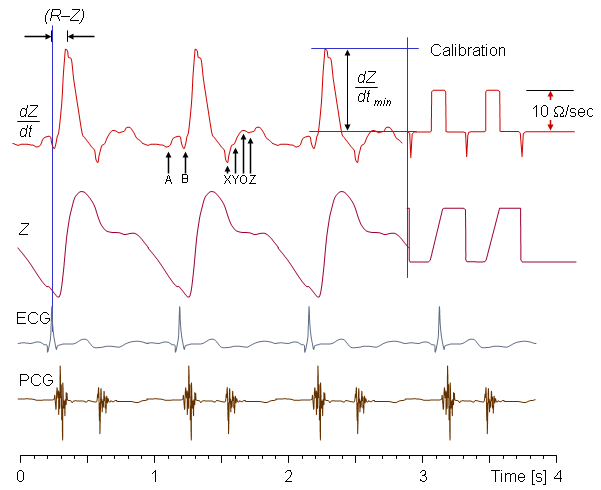
The amount of blood in the thorax changes as a function of the heart cycle. During systole, the right ventricle ejects an amount of blood into the lungs which equals the stroke volume. At the same time blood flows from the lungs to the left atrium. The effect of these changes in the distribution of blood in the thorax as a function of the heart cycle can be determined by measuring the impedance changes of the thorax. The problem is to determine cardiac stroke volume as a function of changes in thoracic impedance.
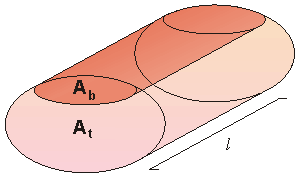
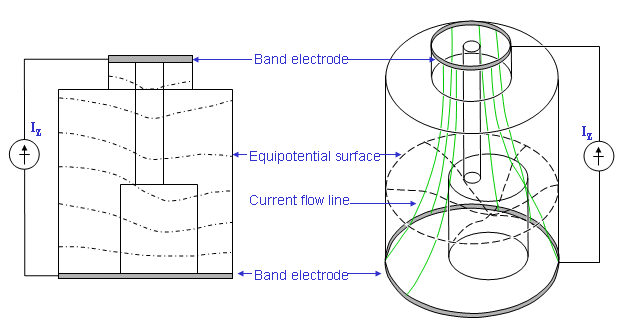
Fig. 25.5 Simplified cylindrical model of the average thorax containing a uniform blood and tissue compartment for determining the net torso impedance.
 | (25.6) |
| where | Z | = longitudinal impedance of the model |
| Zb | = impedance of the blood volume | |
| Zt | = impedance of the tissue volume |
The relationship between the impedance change of the thorax and the impedance change of the blood volume is found by differentiating Equation 25.6 with respect to Zb:
 | (25.7) |
The impedance of the blood volume with blood resistivity rb based on the cylindrical geometry of Figure 25.5, is:
Assuming that Dt equals the ejection time te, DZ can be determined from equation

(25.8)
where rb = blood resistivity Ab = cross-section of the blood area l = length of the thorax model The relationship between changes in blood volume vb and the blood volume impedance is found by solving for the blood volume in Equation 25.8 and differentiating:
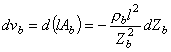
(25.9)
where vb = blood volume We finally derive the dependence of the change in blood volume on the change in thoracic impedance by solving for dZb in Equation 25.7 and substituting it into Equation 25.9:
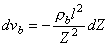
(25.10) 25.3.4 Determining the Stroke Volume
When determining stroke volume from thoracic impedance changes, Kubicek and colleagues (1966) and Kubicek (1968) made some assumptions concerning the relationship between stroke volume and net change in the thorax blood volume as evaluated in Equation 25.10. These assumptions are highly simplified and may be unreliable.
As was mentioned earlier, during systole, the right ventricle ejects a volume of blood into the lungs. Subsequently, blood flows away from the lungs to the left atrium. The stroke volume can thus be determined from the impedance curve by extrapolating to the impedance (DZ), that would result if no blood were to flow out of the lungs during systole. (The underlying assumption is that DZ is determined mainly by changes in lung conductivity.)
In this extrapolation, it is assumed that if no blood were to flow away from the thorax during systole, the thorax impedance would continuously decrease during systole at a rate equal to the maximum rate of decrease of Z. Thus, DZ can be approximated graphically by drawing a tangent to the impedance curve at the point of its maximum rate of decrease, as illustrated in Figure 25.6. Then, the difference between the impedance values of the tangent line at the beginning and at the end of the ejection time is DZ.
The value of DZ is easy to determine with the help of the first derivative curve of the thoracic impedance signal. According to the definition of the derivative:

(25.11)

(25.12) With the above assumptions, the impedance change DZ can be determined by multiplying the ejection time by the minimum value of the first derivative of the impedance curve (that is, the maximum slope magnitude; the reader must remember that the slope is negative).
Finally, the formula for determining the stroke volume is obtained by substituting Equation 25.12 into Equation 25.10, which gives:
(25.13)
where SV = stroke volume [ml] rb = resistivity of the blood [W·cm] l = mean distance between the inner electrodes [cm] Z = mean impedance of the thorax [W] 
= absolute value of the maximum deviation of the first derivative signal during systole [W/s] te = ejection time [s] The ejection time can be determined from the first-derivative impedance curve with the help of the phonocardiogram or carotid pulse. Then, the impedance curve itself is used only for control purposes (e.g., checking the breathing).
The resistivity of the blood is of the order of 160 Wcm. Its value depends on hematocrit, as discussed in Section 7.4.
Sakamoto et al. (1979) constructed an anatomically more realistic model in which changes in vena cava, heart, lungs, aorta, and torso shape were investigated (see Figure 25.8). The model permits an examination of the effect of conductivity changes of component structures on the measured impedance. The weakness in this work is that one does not know what quantitative changes in conductivity are brought about as a result of real or simulated blood circulation. Sakamoto et al. (1979) also did studies with dogs and humans where they measured the isopotential lines on the surface of the thorax.
Witsoe and Kottke (1967) conducted experiments with dogs, using venous occlusion achieved by an inflated ball. In these experiments the origin of the impedance signal was found to be contributed totally by the left ventricle. (This is also seen in humans.) Stroke volume measurements with impedance plethysmography on patients with aortic valve insufficiency give values that are too high.
Penney (1986) summarized a number of studies and estimated, on the base of these observations, the contributions to the impedance signal shown in Table 25.1.
| Contributing organ | Contribution |
| Vena cava and right atrium | +20% |
| Right ventricle | -30% |
| Pulmonary artery and lungs | +60% |
| Pulmonary vein and left atrium | +20% |
| Left ventricle | -30% |
| Aorta and thoracic musculature | +60% |
| Source: Penney (1986) | |
Mohapatra (1981) conducted a critical analysis of a number of hypotheses concerning the origin of the cardiac impedance signal. He concluded that it was due to cardiac hemodynamics only. Furthermore, the signal reflects both a change in the blood velocity as well as change in blood volume. The changing speed of ejection has its primary effect on the systolic behavior of DZ whereas the changing volume (mainly of the atria and great veins) affects the diastolic portion of the impedance curve.
These facts point out that the weakest feature of impedance plethysmography is that the source of the signal is not accurately known. Additional critical comments may be found in Mohapatra (1988).
25.4.3 Determining the Systolic Time Intervals from the Impedance Signal
Lababidi et al. (1970) carefully studied the timing of each significant notch in the first derivative curve of the thoracic impedance signal and assigned them to certain events in the heart cycle. According to their study, the relationship is as shown in Table 25.2 (see also Figure 25.3).
| Event in the cardiac cycle | Notch |
| Atrial contraction | A |
| Closure of tricuspid valve | B |
| Closure of aortic valve | X |
| Closure of pulmonic valve | Y |
| Opening snap of mitral valve | O |
| Third heart sound | Z |
| Source: Lababidi et al., (1970) | |
The first-derivative impedance curve can be used with some accuracy in timing various events in the cardiac cycle. The ejection time can be determined as the time between where the dZ/dt curve crosses the zero line after the B point, and the X point. However, in general, the determination of ejection time from the dZ/dt curve is more complicated. Thus, the need of the phonocardiogram in determining the ejection time depends on the quality and clarity of the dZ/dt curve. Though the timing of the various notches of the dZ/dt curve is well known, the origins of the main deflections are not well understood.
Hill, Jaensen, and Fling (1967) have introduced a critical comment concerning the effect of the contact impedance on the signal: they claim that the entire signal is an electrode artifact. Based on the preceding arguments and the experiments concerning the origin of the signal (Lababidi et al., 1971; Baker, Hill, and Pale, 1974) these claims can be ignored.
The effect of changes in the mean thoracic impedance has also been investigated (Hill and Lowe, 1973). Placement of a defibrillator back electrode under the back of a supine patient changed the mean impedance recorded by the instrument by up to 20%, but did not have any significant influence on the stroke volume value determined by the instrument, because of a simultaneous change in (dZ/dt)min, which compensated for the change in Z. This is easily seen by noting that stroke volume is proportional to Z-2, whereas dZ is proportional to Z2. Slight displacement of the detector electrodes changes the measured mean impedance and first derivative signal, but their effect on the computed stroke volume is compensated by the changed value of the mean distance of the electrodes. This is also easy to prove using the previous theory. It is also interesting to note that the signals remain unchanged when one half of the lower detector electrode is removed (Hill and Lowe, 1973). This implies that the electrode is situated on an equipotential surface, thus supporting the assumption of cylindrical symmetry.
 | (25.14) |
| where | DZ | = change of the impedance of the thorax |
| Z | = mean value of the impedance of the thorax | |
| vtx | = volume of the thorax between the inner electrode pair |
They used the Fick principle as a reference for evaluating stroke volume. (The Fick principle determines the cardiac output from the oxygen consumption and the oxygen contents of the atrial and venous bloods.) In a study of six subjects at various exercise levels, the correlation between the impedance and Fick cardiac outputs was r = 0.962, with an estimated standard error of 12% of the average value of the cardiac output.
Harley and Greenfield (1968) performed two series of experiments with simultaneous dye dilution and impedance techniques. They estimated DZ from the impedance curve itself, instead of using the first-derivative technique. In the first experiment, 13 healthy male subjects were examined before and after an intravenous infusion of isoproterenol. The mean indicator dilution cardiac output was 6.3  /min before and 9.5 /min after infusion. The ratios of the cardiac outputs measured with impedance plethysmography and indicator dilution were 1.34 and 1.23, respectively. This difference (p > .2) was not significant. The second experiment included 24 patients with heart disease, including aortic and mitral insufficiencies. A correlation coefficient of r = .26 was obtained for this data. The poor correlation was caused in those cases with aortic and mitral insufficiency.
Bache, Harley, and Greenfield (1969) performed an experiment with eight patients with various types of heart disease excluding valvular insufficiencies. As a reference they used the pressure gradient technique. Individual correlation coefficients ranged from .58 to .96 with an overall correlation coefficient as low as .28.
Baker et al. (1971) compared the impedance and radioisotope dilution values of cardiac output for 17 normal male subjects before and after exercise. The regression function for this data was COZ = 0.80·COI + 4.3 with a correlation coefficient r = .58. The comparison between the paired values before and after exercise showed better correlation for the impedance technique. Baker examined another group of 10 normal male subjects by both impedance and dye techniques. In 21 measurements the regression function was COZ = 1.06·COD + 0.52, with correlation coefficient r = .68. In addition to this set of data, the impedance cardiac output was determined by using individual resistivity values determined from the hematocrit. The relation between resistivity and Hct was, however, not mentioned.
In this case, the regression function was COZ = 0.96·COD + 0.56 with correlation coefficient r = .66. A set of measurements was performed also on 11 dogs using electromagnetic flowmeters and the impedance technique. A comparison of 214 paired data points was made with intravenous injections of epinephrine, norepinephrine, acetylcholine, and isoproterenol. Values of the correlation coefficients from each animal ranged from 0.58 to 0.98 with a mean value of 0.92. The first two experiments of this paper are also presented in Judy et al. (1969).
/min before and 9.5 /min after infusion. The ratios of the cardiac outputs measured with impedance plethysmography and indicator dilution were 1.34 and 1.23, respectively. This difference (p > .2) was not significant. The second experiment included 24 patients with heart disease, including aortic and mitral insufficiencies. A correlation coefficient of r = .26 was obtained for this data. The poor correlation was caused in those cases with aortic and mitral insufficiency.
Bache, Harley, and Greenfield (1969) performed an experiment with eight patients with various types of heart disease excluding valvular insufficiencies. As a reference they used the pressure gradient technique. Individual correlation coefficients ranged from .58 to .96 with an overall correlation coefficient as low as .28.
Baker et al. (1971) compared the impedance and radioisotope dilution values of cardiac output for 17 normal male subjects before and after exercise. The regression function for this data was COZ = 0.80·COI + 4.3 with a correlation coefficient r = .58. The comparison between the paired values before and after exercise showed better correlation for the impedance technique. Baker examined another group of 10 normal male subjects by both impedance and dye techniques. In 21 measurements the regression function was COZ = 1.06·COD + 0.52, with correlation coefficient r = .68. In addition to this set of data, the impedance cardiac output was determined by using individual resistivity values determined from the hematocrit. The relation between resistivity and Hct was, however, not mentioned.
In this case, the regression function was COZ = 0.96·COD + 0.56 with correlation coefficient r = .66. A set of measurements was performed also on 11 dogs using electromagnetic flowmeters and the impedance technique. A comparison of 214 paired data points was made with intravenous injections of epinephrine, norepinephrine, acetylcholine, and isoproterenol. Values of the correlation coefficients from each animal ranged from 0.58 to 0.98 with a mean value of 0.92. The first two experiments of this paper are also presented in Judy et al. (1969).
Experiments with Individual Resistivity Values
Lababidi et al. (1971) studied 95 children with various types of congenital heart disease using dye dilution and Fick principles as reference methods. In 20 subjects, paired impedance-dye dilution values had an average absolute difference of 6.6% ranging from -12% to +13% with a standard deviation of 0.259 /min/m˛. Paired impedance-cardiac output values had an absolute difference of 3.1%, ranging from -15% to +3.2% with a standard deviation of 0.192 /min/m˛. The F-test showed the reproducibility of both methods to be similar: F = 1.82 and p > .05. For 53 sequential determinations of impedance cardiac output and dye dilution, the absolute mean difference was -1.8%, t = 1.19 and p &"62; .05. When determining, sequentially, the relationship between Fick and dye dilution principles, 37 of 39 points fell within 20% limits. The absolute mean difference was 8.3%, and the algebraic mean difference was +3.4%. The correlation between impedance and Fick cardiac outputs was r = .97. These studies were performed with patients without intracardiac shunts or valvular insufficiencies.
A comparison of impedance cardiac output to Fick systemic cardiac output in patients with left to right shunts showed the correlation to be poor: r = .21. However, a comparison of the impedance cardiac output to the Fick pulmonary blood flow in these cases gave a correlation of r = .96 (see Fig. 25.9).
Baker, Hill, and Pale (1974) compared impedance and dye dilution cardiac outputs in three dogs and got a correlation of r = .879.
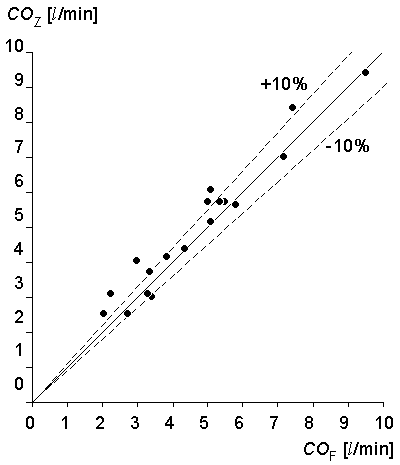
Malmivuo (1974) compared impedance and Fick methods in 18 patients without valvular incompetencies, but with one subject having a left to right shunt. For this special subject a comparison was made to pulmonary blood flow. The regression function was COZ = 0.97·COF + 0.45 yielding a correlation coefficient of r = .97 (see Figure 25.8).
Malmivuo, Orko, and Luomanmäki (1975) compared impedance and Fick methods in 11 patients with atrial fibrillation and without intracardiac shunts or valvular insufficiencies. The regression function was COZ = 1.05·COF + 0.1, with a correlation coefficient of r = .96.
In evaluating the significance of a particular correlation coefficient between impedance and reference methods, Penney points out that the reference methods themselves are not completely consistent. For example, if one considers the correlation coefficient r, then between Fick and dye dilution .95 < r < .999; Fick and thermodilution .70 < r < .99; Fick to carbon dioxide breathing, r = .94; dye to thermodilution, .68 < r < .99.
Concerning the accuracy of impedance plethysmography in determining peripheral blood flow, there are much fewer data available as few detailed experiments have been published. van de Water et al.(1971) reported on a series of measurements in a hind limb of a dog using an electromagnetic flowmeter as a reference method. A correlation of r = .962 was obtained, using a constant value for the resistivity of the blood.
From this it is easy to deduce that if the impedance measurement is made with electrodes placed on one side of the head only or if, when using circular band electrodes, the electrodes are relatively close to each other, the major part of the signal comes from the blood flow in the scalp, not from that in the brain area. This shading effect of the skull does not show up as clearly in the EEG-measurement, because no bioelectric sources exist outside the skull (Malmivuo, 1992).
Van de Water et al. (1971) infused 400 cmł of saline in 25 cmł increments into a thoracic cavity of a dog weighing 15 kg. The regression formula between the infused saline volume and the thoracic impedance was Z = 0.02281 cmł + 46.944 with a correlation coefficient of r = .988. They reported also one case when 900 cmł of pleural fluid was removed from a patient in 50 cmł increments. The regression formula in this case was Z = 0.0024 cmł + 17.57, with a correlation coefficient of r = .965.
The method undoubtedly has some disadvantages. These include the errors caused by aortic valve insufficiency, severe mitral valve insufficiency, and shunts in the circulation in, for example, septal defects or tetralogy of Fallot. The method does not give any indication of the presence of these pathologies, and they must therefore be diagnosed by other means. The method is also difficult to apply to patients with atrial fibrillation.
On the other hand, impedance plethysmography is noninvasive and harmless. The accuracy of the method in careful examinations in patients, excluding the previously mentioned groups, gives promising results. The accuracy in determining the absolute value of cardiac output seems to be of the same order as the accuracy of the dilution methods. The accuracy in determining changes in cardiac output seems to be still higher.
As noted in the previous section, extreme care should be followed in applying impedance plethysmography to measuring the blood flow in the brain area to ensure that the recorded signal really originates mostly from the intracranial region..
Atzler E, Lehmann G (1931-1932): Über ein Neues Verfahren zur Darstellung der Herztätigkeit (Dielektrographie). Arbeitsphysiol. 6: 636-80.
Bache RJ, Harley A, Greenfield JC (1969): Evaluation of thoracic impedance plethysmography as an indicator of stroke volume in man. Am. J. Med. Sci. 258:(8) 100-13.
Baker LE, Hill DW, Pale TD (1974): Comparison of several pulse-pressure techniques for monitoring stroke volume. Med. Biol. Eng. 12:(1) 81-8.
Baker LE, Judy WV, Geddes LE, Langley FM, Hill DW (1971): The measurement of cardiac output by means of electric impedance. Cardiovasc. Res. Cent. Bull. 9:(4) 135-45.
Baumgartner RN, Chunlea WG, Roche AF (1988): Bioelectric impedance phase angle and body composition. Am. J. Clin. Nutr. 48: 16-23.
Cole KS, Cole RH (1941): Dispersion and absorption in dielectrics. J. Chem. Physics 9: 341-51.
Epstein BR, Foster KR (1983): Anisotropy as a dielectric property of skeletal muscle. Med. & Biol. Eng. & Comput. 21:(1) 51-5.
Geselowitz DB (1971): An application of electrocardiographic lead theory to impedance plethysmography. IEEE Trans. Biomed. Eng. BME 18:(1) 38-41.
Harley A, Greenfield JC (1968): Determination of cardiac output in man by means of impedance plethysmography. Aerospace Med. 39:(3) 248-52.
Hill DW, Lowe HJ (1973): The use of the electrical impedance technique for the monitoring of cardiac output and limb blood flow during anesthesia. Med. Biol. Eng. 11:(5) 534-45.
Hill RV, Jaensen JC, Fling JL (1967): Electrical impedance plethysmography: A critical analysis. J. Appl. Physiol. 22:(1) 161-8.
Holzer W, Polzer K, Marko A (1946): RKG. Rheography. A Method of Circulation's Investigation and Diagnosis in Circular Motion, Wilhelm Maudrich, Vienna. (English transl.)
Judy WV, Langley FM, McCowen KD, Stinnet DM, Baker LE, Johnson PC (1969): Comparative evaluation of the thoracic impedance and isotope dilution methods for measuring cardiac output. Aerospace Med. 40: 532-6.
Kinnen E, Kubicek WG, Hill DW, Turton G (1964a): Thoracic cage impedance measurements: Impedance plethysmographic determination of cardiac output (A comparative study). U.S. Air Force School of Aerospace Medicine, Brooks Air Force Base, Texas SAM-TDR-64:(15) 8.
Kinnen E, Kubicek WG, Hill DW, Turton G (1964b): Thoracic cage impedance measurements: impedance plethysmographic determination of cardiac output (An interpretative study). U.S. Air Force School of Aerospace Medicine, Brooks Air Force Base, Texas SAM-TDR-64:(23) 12.
Kinnen E, Kubicek WG, Hill DW, Turton G (1964c): Thoracic cage impedance measurements, tissue resistivity in vivo and transthoracic impedance at 100 kc. U.S. Air Force School of Aerospace Medicine, Brooks Air Force Base, Texas SAM-TDR-64:(5) 14.
Kubicek WG (1968): Minnesota Impedance Cardiograph Model 303. Instruction Manual, 4 pp. Univ. of Minnesota Press, Minneapolis.
Kubicek WG, Karnegis JN, Patterson RP, Witsoe DA, Mattson RH (1966): Development and evaluation of an impedance cardiac output system. Aerospace Med. 37:(12) 1208-12.
Kubicek WG, Patterson RP, Witsoe DA (1970): Impedance cardiography as a non-invasive method for monitoring cardiac function and other parameters of the cardiovascular system. Ann. N.Y. Acad. Sci. 170: 724-32.
Kushner RF, Shoeller DA (1986): Estimation of total body water by bioelectrical impedance analysis. Am. J. Clin. Nutr. 44:(Sept.) 417-24.
Lababidi Z, Ehmke DA, Durnin RE, Leaverton PE, Lauer RM (1970): The first derivative thoracic impedance cardiogram. Circulation 41:(4) 651-8.
Lababidi Z, Ehmke DA, Durnin RE, Leaverton PE, Lauer RM (1971): Evaluation of impedance cardiac output in children. Pediatr. 47:(5) 870-9.
Lamberts R, Visser KR, Ziljstra WG (1984): Impedance Cadiography, 160 pp. Van Gorcum, Assen, The Netherlands.
Lehr J (1972): A vector derivation useful in impedance plethysmographic field calculations. IEEE Trans. Biomed. Eng. BME-19:(2) 156-7.
Lozano A, Rosell J, Pallás-Areny R (1990): Two-frequency impedance plethysmograph: real and imaginary parts. Med. & Biol. Eng. & Comput. 28:(1) 38-42.
Lukaski HC, Johnson PE, Bolonchuk WW, Lykken GI (1985): Assessment of fat-free mass using bioelectrical impedance measurement of the human body. Am. J. Clin. Nutr. 41:(April) 810-7.
Malmivuo JA (1974): Impedance Plethysmography, Helsinki University Central Hospital, I Medical Clinic, Helsinki. (Report)
Malmivuo JA (1992): Distribution of electric current in inhomogeneous volume conductors. In Proceedings of the 8th Internat. Conference On Electrical Bio-Impedance, ed. T Lahtinen, pp. 18-20, University of Kuopio, Center for Training and Development, Kuopio, Finland.
Malmivuo JA, Orko R, Luomanmäki K (1975): Validity of impedance cardiography in measuring cardiac output in patients with atrial fibrillation. In Proceedings of The III Nordic Meeting On Medical and Biological Engineering, ed. A Uusitalo, N Saranummi, pp. 58.1-3, Finnish Society for Medical and Biological Engineering, Tampere, Finland.
Maniewski R, Katila T, Poutanen T, Siltanen P, Varpula T, Wikswo JP (1988): Magnetic measurement of cardiac mechanical activity. IEEE Trans. Biomed. Eng. 35:(9) 662-70.
Mohapatra SN (1981): Noninvasive Cardiovascular Monitoring of Electrical Impedance Technique, Pitman, London.
Mohapatra SN (1988): Impedance cardiography. In Encyclopedia of Medical Devices and Instruments, ed. JG Webster, pp. 1622-32, John Wiley & Sons, New York.
Nyboer J (1950): Plethysmography. Impedance. In Medical Physics, Vol. 2, ed. O Glasser, pp. 736-43, Year Book Pub., Chicago.
Nyboer J, Bango S, Barnett A, Halsey RH (1940): Radiocardiograms: Electrical impedance changes of the heart in relation to electrocardiograms and heart sounds. J. Clin. Invest. 19: 773. (Abstract.).
Nyboer J, Bango S, Nims LF (1943): The impedance plethysmograph and electrical volume recorder. CAM Report, OSPR : 149.
Penney BC (1986): Theory and cardiac applications of electrical impedance measurements. CRC Crit. Rev. Bioeng. 13: 227-81.
Plonsey R, Collin R (1977): Electrode guarding in electrical impedance measurements of physiological systems - A critique. Med. & Biol. Eng. & Comput. 15: 519-27.
Rosa L (1940): Diagnostische Anwendung des Kurzwellenfeldes in der Herz und Kreislaufpathologie (Radiokardiographie). Z. Kreislaufforsch. 32: 118-35.
Sakamoto K, Muto K, Kanai H, Iizuka M (1979): Problems of impedance cardiography. Med. & Biol. Eng. & Comput. 17:(6) 697-709.
Schwan HP, Kay CF (1957): Capacitive properties of body tissues. Circ. Res. 5:(4) 439-43.
Siegel JH, Fabian M, Lankau C, Levine M, Cole A, Nahmad M (1970): Clinical and experimental use of thoracic impedance plethysmography in quantifying myocardial contractility. Surgery 67: 907-17.
Tanaka K, Kanai H, Nakayama K, Ono N (1970): The impedance of blood: The effects of red cell orientation and its application. Jpn. J. Med. Eng. 8: 436-43.
Tienko MI, Smirnov AD, Danilov LN, Aleksandrov AL (1973): Characteristics and clinical use of integral rheography. A new method of measuring the stroke volume. Kardiologiia 13: 54-62.
de Vries PMJM, Meijer JH, Vlaanderen K, Visser V, Donker AJM, Schneider H (1989): Measurement of transcellular fluid shift during haemodialysis. Med. & Biol. Eng. & Comput. 27:(March) 152-8.
van de Water JM, Dmochowski JR, Dove GB, Couch NP (1971): Evaluation of an impedance flowmeter in arterial surgery. Surgery 70:(6) 954-61.
van de Water JM, Philips PA, Thouin LG, Watanabe LS, Lappen RS (1971): Bioelectric impedance. New developments and clinical application. Arch. Surg. 102:(6) 541-7.
Wikswo JP (1975): Non-invasive magnetic measurement of the electrical and mechanical activity of the heart. Stanford University, Stanford, Thesis, pp. 304. (Ph.D. thesis)
Witsoe DA, Kottke FJ (1967): The origin of cardiogenic changes in thoracic electrical impedance (del Z). Feder. Proc. 26: 595. (Abstract No 1890).
Yamamoto Y, Yamamoto T, Öberg PĹ (1991): Impedance plethysmography in human limbs. Part 1. On electrodes and electrode geometry. Med. & Biol. Eng. & Comput. 29: 419-24.
Yamamoto Y, Yamamoto T, Öberg PĹ (1992): Impedance plethysmography for blood flow measurements in human limbs. Part 2. Influence of limb cross-sectional area. Med. & Biol. Eng. & Comput. 30:(Sept.) 518-24.
Zhao T (1992): Electrical capacitance of human blood. In Proc. Of the 8th Internat. Conf. Of Electrical Bioimpedance, 1st ed. Vol. 1, ed. T Lahtinen, pp. 185-7, University of Kuopio, Kuopio, Finland.