17.1 MOVING DIPOLE
We have noted that the source associated with cardiac activation is a double layer, which lies at the activation surface. This double layer can be approximated by a single resultant dipole. As the activation front in the ventricular wall progresses, the dipole which is at the center of gravity of the cover that closes the cup-like activation front, also moves. Consequently, the location of the equivalent electric dipole of the heart tracks this movement. However, if there is more than one simultaneous activation wave, this movement will be a complex function of the movement of the individual resultant dipoles. When one is trying to develop an improved model for the cardiac electric generator, the moving dipole is a logical target of interest.
 R. M. Arthur conducted experiments to evaluate the moving dipole (Arthur et al., 1971). In these experiments he used a finite homogeneous model for the torso. It appeared that the path of the moving electric center of the cardiac activation is within the heart border throughout the cardiac cycle, in the atria during the P-wave and in the ventricles during the QRS- and T-waves.
 Additional insight into the moving dipole model was gained through more recent work by Pierre Savard and colleagues (Savard et al., 1980). These investigators used an animal model so that the computed trajectory could be compared with actual intramural cardiac data. They obtained their best results when there was only a single confined activation surface, a result that is not unexpected. For this reason, some recent investigators have been examining a two moving dipole model.
17.2 MULTIPLE DIPOLE
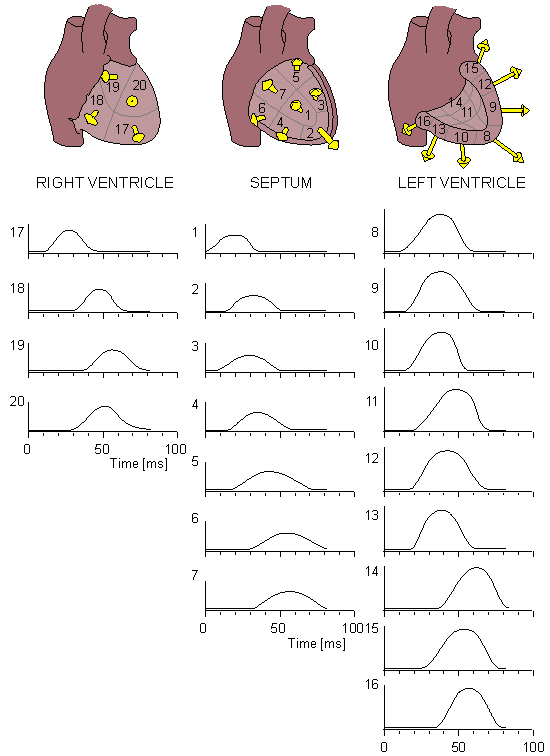
The first suggestion for a multiple dipole model of the heart was made by E. J. Fischmann and M. R. Barber (1963). Based on this idea Ronald Selvester constructed a computer model consisting of 20 dipoles (Selvester, Collier, and Pearson, 1965). In this first model the effect of the thorax boundary and internal inhomogeneities were omitted. Selvester later constructed another model in which these effects were included (Selvester et al., 1966; see Figure 17.1).
 J. H. Holt and his colleagues formulated a model consisting of 12 dipoles, whose locations and directions in the myocardium were fixed (Holt et al., 1969a). To evaluate these dipoles, he recorded ECG signals from an 126-electrode array on the surface of the thorax. The number of the electrodes was intentionally selected to be an order of magnitude larger than the number of variables in the multiple-dipole model. This step provided an opportunity to improve accuracy based on the redundancy, and could compensate for missing signals and for the presence of noise (Lynn et al., 1967)..

Fig. 17.1 Multiple-dipole model of Selvester.
17.3 MULTIPOLE
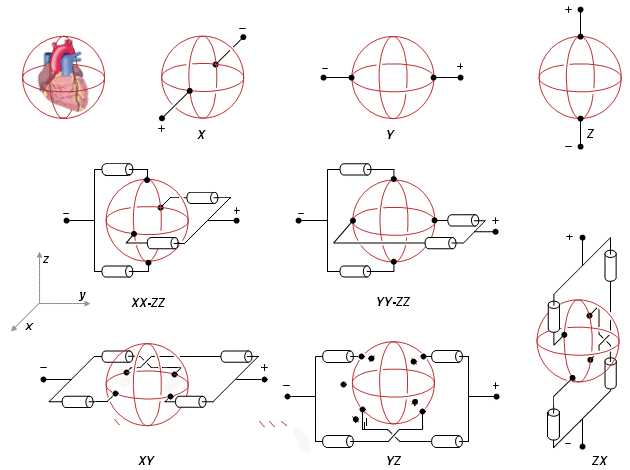
The multipole model is based on a spherical harmonic expansion of the volume source and its components are dipole, quadrupole, octapole, and so on. These components of the multipole model have the following number of independent variables: 3 for dipole, 5 for quadrupole, 7 for octapole, and so on. The first scientists to apply the multipole model to cardiac modeling were G. Yeh and colleagues (1958). Research with multipole models has been further extended by David Geselowitz (Geselowitz, 1960) and Daniel Brody (Brody, Bradshaw, and Evans, 1961).
 Figure 17.2 illustrates the basic principle involved in measuring the dipole and quadrupole components of a source lying in a spherical conductor. In actuality, instead of resistor weighing, many electrodes are used and the multipole components are evaluated numerically. The procedure is discussed in Pilkington and Plonsey (1982).
 In his research, R. M. Arthur (Arthur et al., 1972), when trying to fit the dipole model to potentials measured at 284 points on the thorax surface, found that the best fit showed an error of 23%. When the quadrupole component was added to the model, the best fit showed an error of 14%. Therefore, the inclusion of the quadrupole component decreased the error by 9%.
 A more detailed description of the cardiac models presented here and a critical evaluation of their strengths and weaknesses may be found in Pilkington and Plonsey (1982) and in Gulrajani (1989). As noted, there is growing interest in using multiple body-surface electrodes (25-250) and employing the displayed output to produce a sequence of equipotential surface maps..

Fig. 17.2 The principle of the measurement of dipole and quadrupole components in a spherical volume conductor.
17.4 SUMMARY OF THE ECG LEAD SYSTEMS
We briefly discuss the possibilities of evaluating the diagnostic performance of the ECG by improving the model of the source and conductor in light of the investigations discussed above. For this purpose we define the clinical concepts of sensitivity, specificity, and diagnostic performance.
 Sensitivity denotes the relative number of abnormals that are detected by the system. Specificity denotes the relative number of normals that are classified as normals. The concept of diagnostic performance is defined as the average of the sensitivity and specificity of the method (Macfarlane and Lawrie, 1989). We summarize these definitions below:
  | (17.1) |
  | (17.2) |
  | (17.3) |
| where | FN | = false negatives |
| FP | = false positives | |
| TN | = true negatives | |
| TP | = true positives |
 The investigation of Holt, based on the multiple dipole model, gave remarkably good results (Holt et al., 1969b,c). In the diagnosis of hypertrophy the diagnostic performance was about 90%. However, for the diagnosis of myocardial infarction the Holt et al. method gave a diagnostic performance of about 80%. Thus, in spite of being much more sophisticated, it did not achieve better results than the simpler conventional approaches.
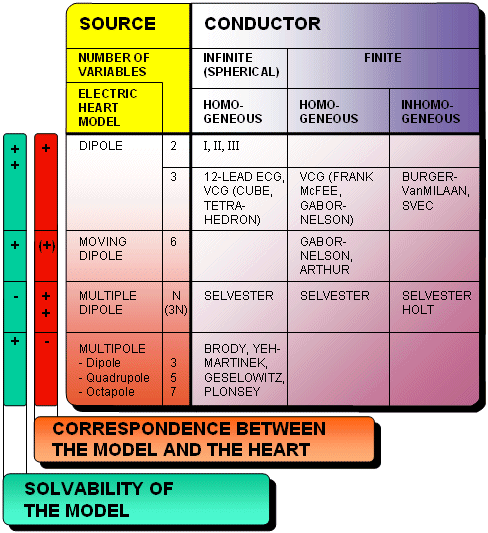
 Table 17.1 summarizes the volume source and volume conductor models used as the basis for various ECG systems and ECG research. It would be natural to select the most accurate model for the volume source as well as for the volume conductor when trying to solve the inverse problem most accurately. Hence the choice of modeling approaches should be located on the right side and on one of the lowest rows in Table 17.1.
Arthur RM, Geselowitz DB, Briller SA, Trost RF (1971): The path of the electrical center of the human heart determined from surface electrocardiograms. J. Electrocardiol. 4:(1) 29-33.
Arthur RM, Geselowitz DB, Briller SA, Trost RF (1972): Quadrupole components of the human surface electrocardiogram. Am. Heart J. 83:(5) 663-7.
Brody DA, Bradshaw JC, Evans JW (1961): A theoretical basis for determining heart-lead relationships of the equivalent cardiac multipole. IRE Trans. Biomed. Electron. BME-8:(4) 139-43.
Fischmann EJ, Barber MR (1963): 'Aimed' electrocardiography. Model studies, using a heart consisting of 6 electrically isolated areas. Am. Heart J. 65:(5) 628-37.
Geselowitz DB (1960): Multipole representation for an equivalent cardiac generator. Proc. IRE 48:(1) 75-9.
Gulrajani RM (1989): The inverse problem of electrocardiography. In Comprehensive Electrocardiology. Theory and Practice in Health and Disease, 1st ed. Vol. 1, ed. PW Macfarlane, TDV Lawrie, pp. 237-88, Pergamon Press, New York.
Gulrajani RM, Savard P, Roberge FA (1988): The inverse problem in electrocardiography: Solution in terms of equivalent sources. CRC Crit. Rev. Biomed. Eng. 16: 171-214.
Holt JH, Barnard ACL, Lynn MS, Svendsen P (1969): A study of the human heart as a multiple dipole electrical source. I. Normal adult male subjects. Circulation 40:(Nov) 687-96.
Holt JH, Barnard CL, Lynn MS (1969): A study of the human heart as a multiple dipole electrical source. II. Diagnosis and quantitation of left ventricular hypertrophy. Circulation 40:(Nov) 697-710.
Holt JH, Barnard CL, Lynn MS, Kramer JO (1969): A study of the human heart as a multiple dipole electrical source. III. Diagnosis and quantitation of right ventricular hypertrophy. Circulation 40:(Nov) 711-8.
Lynn MS, Barnard ACL, Holt JH, Sheffield LT (1967): A proposed method for the inverse problem in electrocardiology. Biophys. J. 7:(6) 925-45.
Macfarlane PW, Lawrie TDV (1989): The normal electrocardiogram and vectorcardiogram. In Comprehensive Electrocardiology: Theory and Practice in Health and Disease, 1st ed. Vol. 1, ed. PW Macfarlane, TDV Lawrie, pp. 407-57, Pergamon Press, New York.
Pilkington TC, Plonsey R (1982): Engineering Contributions to Biophysical Electrocardiography, 248 pp. IEEE Press, John Wiley, New York.
Rudy Y, Messinger-Rapport B (1988): The inverse problem of electrocardiography. Solutions in terms of epicardial potentials. CRC Crit. Rev. Biomed. Eng. 16: 215-68.
Savard P, Roberge FA, Perry J-B, Nadeau RA (1980): Representation of cardiac electrical activity by a moving dipole for normal ectopic beats in the intact dog. Circ. Res. 46:(3) 415-25.
Selvester RH, Collier CR, Pearson RB (1965): Analog computer model of the vectorcardiogram. Circulation 31:(1) 45-53.
Selvester RH, Kalaba R, Collier CR, Bellman R, Kagiwada H (1966): A mathematical model of the electric field of the heart with distance and boundary effects. In Proc. Long Island Jewish Hosp. Symposium: Vectorcardiography 1965, ed. I Hoffman, pp. 403-10, North-Holland Publishing, Amsterdam.
Yeh GCK, Martinek J, Beaumont H (1958): Multipole representation of current generators in a volume conductor. Bull. Math. Biophys. 20:(1) 203-14.
Macfarlane,PW and Lawrie,TDV (eds.) (1989): Comprehensive Electrocardiology: Theory and Practice in Health and Disease. 1st ed. Vols. 1, 2, and 3. Pergamon Press, New York. 1785 p.
 In Section 7.5.4, it was noted that any model should have good correspondence with the physiological preparation it represents, to have clinical importance. Application of this principle would lead to the choice of the multiple dipole model, since it simulates each region of the myocardium.
 The components of the multipole model are orthogonal and can be shown to have a unique solution; however, it is difficult to conceptualize the physiological meaning of this solution. On the other hand, one can show that the evaluation of a multiple dipole model beyond three or four dipoles becomes very sensitive to noise and errors in geometry. The problem is ill-defined. Furthermore, the interpretation of an inverse dipole in terms of underlying cellular behavior is unclear and probably also not unique. Fundamentally, the inverse problem in regard to intramural sources is not unique; this is, in a nutshell, the underlying problem of the inverse solution in ECG. For this reason, it is evident that the single dipole model remains central in clinical electrocardiology.
 In recent years a number of sophisticated mathematical techniques have been applied to the inverse problem in electrocardiography. These now concentrate data from lead systems composed of large numbers of electrodes (100-200). In addition, the goal, rather than a search for intramural information, is limited to a determination of epicardial surface potentials. In principle, these are uniquely determined by the body surface potentials, and they additionally provide enhanced regional information. The various approaches utilize different ways to stabilize what is an ill-conditioned problem (involving inversion of ill-conditioned matrices). Such methods depend on a priori physiological constraints such as the outward propagation of activity or the spectral properties and the amplitude of the noise, smoothness of potential distributions, or smoothness of their gradients/Laplacians.
 The reader is referred to three publications that review and summarize the current status of inverse electrocardiography, namely Pilkington and Plonsey (1982), Gulrajani (1988; 1989), and Rudy and Messinger-Rapport (1988).
REFERENCES
REFERENCE, BOOKS


