


18
Distortion Factors in the ECG
 None of these assumptions are met clinically, and therefore, the VCG signal deviates from the ideal. In addition, there are errors due to incorrect placement of the electrodes, poor electrode-skin contact, other sources of noise, and finally instrumentation error. The character and magnitude of these inaccuracies are discussed in the following sections.
This effect has been discussed in many publications. In the following, part of the data from a study of Jari Hyttinen (1989, 1993a,b) is presented. Hyttinen constructed a computer model from the transfer impedance data of a physical torso model constructed by Stanley Rush (1975). The computer model used a cubic spline fitting of the data to interpolate the lead vectors for all points of the thorax surface in relation to all points within the heart area. The real values of the 12 lead vectors of the standard 12-lead system were calculated with this model. The result is illustrated in Figure 18.1. It is apparent that the biggest errors are the very high sensitivities of the leads V2 and V3 as well as the form of the enhancement of the vertical forces in the frontal plane. The frontal plane is also tilted backwards. These effects are similar to those obtained from the image surface of the finite, homogeneous torso model of Frank..
None of these assumptions are met clinically, and therefore, the VCG signal deviates from the ideal. In addition, there are errors due to incorrect placement of the electrodes, poor electrode-skin contact, other sources of noise, and finally instrumentation error. The character and magnitude of these inaccuracies are discussed in the following sections.
This effect has been discussed in many publications. In the following, part of the data from a study of Jari Hyttinen (1989, 1993a,b) is presented. Hyttinen constructed a computer model from the transfer impedance data of a physical torso model constructed by Stanley Rush (1975). The computer model used a cubic spline fitting of the data to interpolate the lead vectors for all points of the thorax surface in relation to all points within the heart area. The real values of the 12 lead vectors of the standard 12-lead system were calculated with this model. The result is illustrated in Figure 18.1. It is apparent that the biggest errors are the very high sensitivities of the leads V2 and V3 as well as the form of the enhancement of the vertical forces in the frontal plane. The frontal plane is also tilted backwards. These effects are similar to those obtained from the image surface of the finite, homogeneous torso model of Frank..
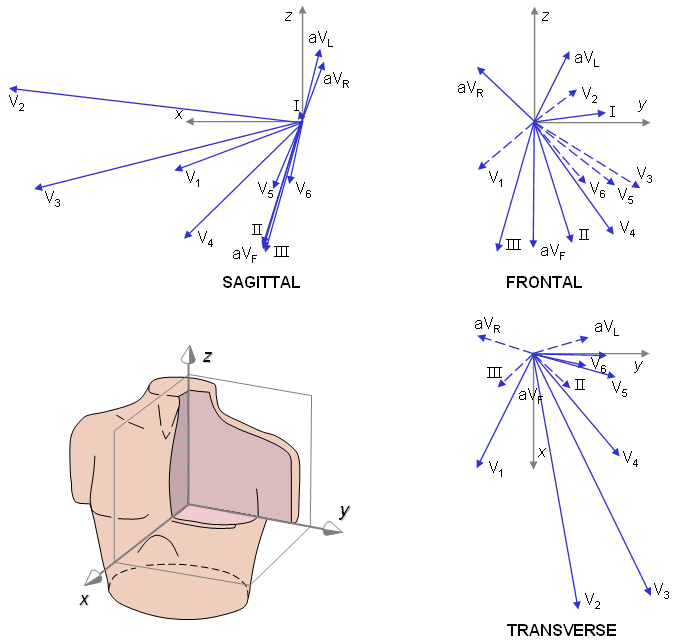
Fig. 18.1 The lead vectors of the standard 12-lead ECG in a finite, homogeneous torso model calculated from the model of Hyttinen (1989; 1993). Compare with the idealized lead vectors shown in Figure 15.9.
From the above data one notes that the conductivity increases about 10-fold from the lungs to the intracardiac blood mass. Therefore, the lead field current path tends to include the well-conducting intracardiac blood mass. Consequently, the lead field bends from the linear direction of the homogeneous model to the radial direction, as illustrated in Figure 18.2. As a consequence, the ECG lead is more sensitive to radial than tangential dipole elements, in contrast to the homogeneous model which predicts that the sensitivity is uniform and unrelated to gross myocardial anatomy. This phenomenon is called the Brody effect. The Brody effect is, in fact, more complicated than described above, as reported by van Oosterom and Plonsey (1991).
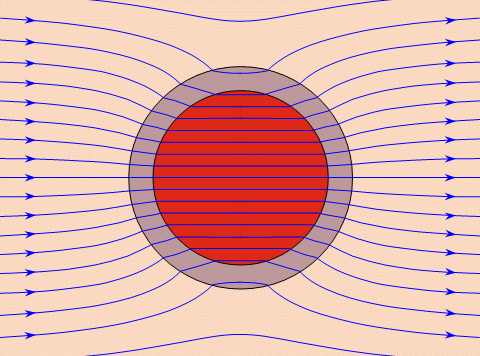
Fig. 18.2 The Brody effect. The spherical volume represents the more highly conducting intracavitary blood mass. Its effect on an applied uniform lead field shows an increased sensitivity to radial and decreased sensitivity to tangential dipoles in the heart muscle region.
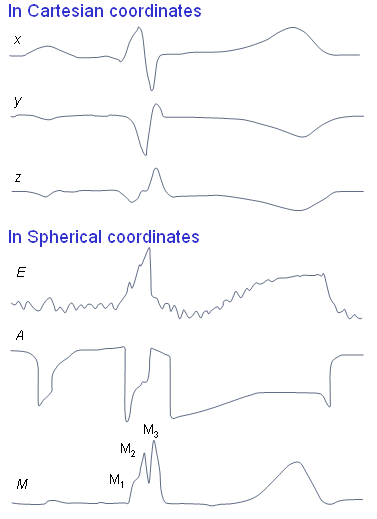
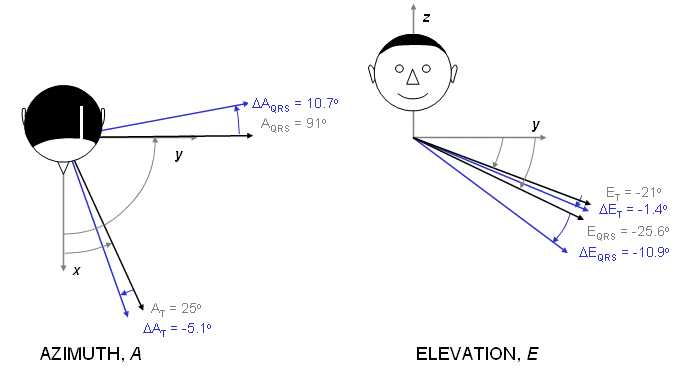
Fig. 18.3 The electric heart vector of a dog in the consistent orthogonal and spherical coordinates of Appendix A. (M = magnitude, E = elevation angle, A = azimuth angle.)
These investigators noted that during the QRS-complex the electric heart vector exhibits three different peaks, which they named M1, M2, and M3. It is known that from these, the peaks M1 and M2 arise mainly from radial electric forces and the peak M3 arises mainly from tangential forces (though, unfortunately, they did not confirm this interpretation with intramural source measurements).
Millard modified the extent of the Brody effect by changing the volume of the left ventricle during the QRS-complex by venesection - that is, by removing blood with a catheter. As a consequence, the M2 peak decreased and the M3 peak increased. The effect was stronger as more blood was removed from the ventricle, as can be seen in Figure 18.4.
These experimental results are easy to explain. As mentioned, the M2 peak is formed from radial electric forces, which are enhanced by the Brody effect. If this effect is attenuated by venesection, the corresponding peak is attenuated. The peak M3 is formed from tangential forces, which are attenuated by the Brody effect. If the Brody effect is reduced by venesection, the corresponding M3 signal will be less attenuated (i.e., increased in magnitude).
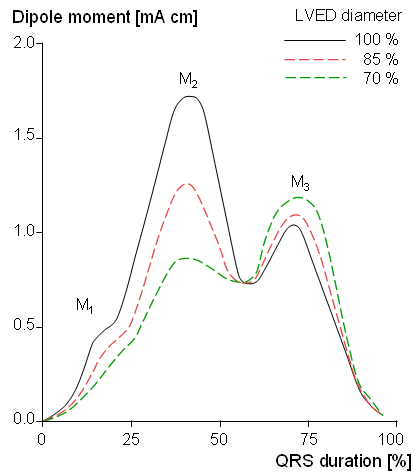 | 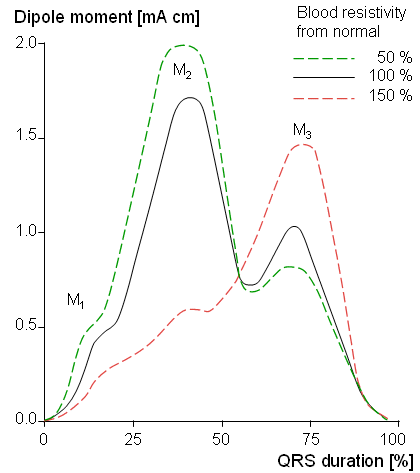 |
Fig. 18.4 The effect of decreasing the ventricular volume on the electric heart vector amplitude. LVED = left ventricular end-diastolic. |
Fig. 18.5 The effect of blood resistivity on the magnitude of the electric heart vector. |
When the blood resistivity was decreased to half-normal value, the Brody effect increased and consequently the M2 peak, which is believed to correspond to the radial part of the activation, also increased. The M3 peak, corresponding to the tangential part of the activation, decreased. When the resistivity was increased fourfold, the opposite effect was produced on the electric heart vector, as expected (see Figure 18.5). Note that in the latter case the Brody effect should not arise, and the lead fields should be less distorted since the nominal intracavitary and muscle resistivities are equal. However, since the cardiac muscle is anisotropic, these ideas are only approximate.
Although the Brody effect of the intracavitary blood is clearly demonstrated, the effect is diminished, when the remaining inhomogeneities are included.
Both abnormally low and high lung conductivities reduce the magnitude of surface potentials.
Low skeletal muscle conductivity enhances the surface potentials.
Increasing heart conductivity results in an increase in body surface potentials.
Other investigators have used realistic models of torso, lungs, heart, etc. to determine the effect of inhomogeneities. Gulrajani and Mailloux (1983) showed that the introduction of inhomogeneities in their model simulation of body surface potentials results in a smoothing of the contours without a large change in the pattern. Because of the predominant endocardial to epicardial activation, they noted a very significant Brody effect. In addition to the spatial filtering noted above, these investigations also reported temporal filtering of the ECG signal.
We have already mentioed the work of Horá ek (1974), who investigated the effect of the blood mass and the lungs in a realistic torso model through the changes seen in the image surface. A review of the current status of understanding of the effect of inhomogeneities in electrocardiology is found in Gulrajani, Roberge, and Mailloux (1989).
Figure 18.7 shows the effect of inspiration on the electric heart vector elevation compared to the midrespiration state. The effect is statistically significant only at 1/10 the normalized QRS-complex duration. The effect of inspiration on the azimuth angle of the QRS and T vectors is illustrated in Figure 18.8.
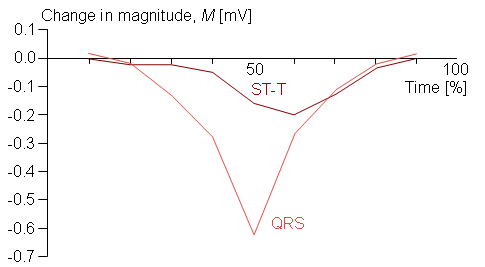 | 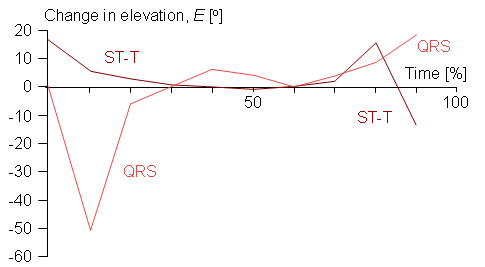 |
Fig. 18.6 The effect of inspiration on the electric heart vector during the QRS-complex and ST-T-wave. The ordinate plots the difference in magnitude [mV] between heart vector magnitude determined in midrespiration and full inspiration. The abscissa shows the QRS- or ST-T-interval divided into 10 equal points (so that the corresponding waveforms are time-normalized). |
Fig. 18.7 Effect of inspiration on the elevation angle of the time normalized heart vector for the QRS-complex and T-wave (top and bottom, respectively) shown in the consistent coordinate system of Appendix A. The change in angle between midrespiration and full inspiration is shown. |
Brody DA (1956): A theoretical analysis of intracavitary blood mass influence on the heart-lead relationship. Circ. Res. 4:(Nov.) 731-8.
Gulrajani RM, Mailloux GE (1983): A simulation study of the effects of torso inhomogeneities on electrocardiographic potentials using realistic heart and torso models. Circ. Res. 52: 45-56.
Gulrajani RM, Roberge FA, Mailloux GE (1989): The forward problem of electrocardiography. In Comprehensive Electrocardiology: Theory and Practice in Health and Disease, 1st ed. Vol. 1, ed. PW Macfarlane, TDV Lawrie, pp. 237-88, Pergamon Press, New York.
Horácek BM (1974): Numerical model of an inhomogeneous human torso. In Advances in Cardiology, Vol. 10, ed. S Rush, E Lepeshkin, pp. 51-7, S. Karger, Basel.
Hyttinen J (1989): Development of aimed ECG-leads. Tampere Univ. Tech., Tampere, Finland, Thesis, pp. 138. (Lic. Tech. thesis)
Hyttinen J, Eskola H, Malmivuo J (1993): Sensitivity properties of the 12-lead ECG - A realistic thorax model study. : . (To be published).
Hyttinen JAK, Malmivuo JAV, Walker SJ (1993): Lead field of ECG leads calculated with a computer thorax model - An application of reciprocity. In Proc. 1993 Computers in Cardiology Meeting, ed. A Murray, Imperial College, London.
Nelson CV, Rand PW, Angelakos TE, Hugenholtz PG (1972): Effect of intracardiac blood on the spatial vectorcardiogram. Circ. Res. 31:(7) 95-104.
van Oosterom A, Plonsey R (1991): The Brody effect revisited. J. Electrocardiol. 24:(4) 339-48.
Rudy Y, Plonsey R, Liebman J (1979): The effects of variations in conductivity and geometrical parameters on the electrocardiogram, using an eccentric spheres model. Circ. Res. 44: 104-11.
Rush S (1975): An Atlas of Heart-Lead Transfer Coefficients, 211 pp. University Press of New England, Hanover, New Hampshire.
Ruttkay-Nedecký I (1971): Respiratory changes of instantaneous spatial cardiac vectors. In Vectorcardiography 2. Proc. XIth Internat. Symp. Vectorcardiography, New York 1970, ed. I Hoffman, RI Hamby, E Glassman, pp. 115-8, North-Holland Publishing, Amsterdam.
Simonson E, Horibe H, Okamoto N, Schmitt OH (1966): Effect of electrode displacement on orthogonal leads. In Proc. Long Island Jewish Hosp. Symposium, Vectorcardiography, ed. I Hoffman, p. 424, North-Holland Publishing, Amsterdam.
Voukydis PC (1974): Effect of intracardiac blood on the electrocardiogram. N. Engl. J. Med. 9: 612-6.
Woo EJ (1990): Finite element method and reconstruction algorithms in electrical impedance tomography. Dept. of Electrical and Computer Eng., Univ. of Wisconsin, Madison, (Ph.D. thesis)
Macfarlane PW, Lawrie TDV (eds.) (1989): Comprehensive Electrocardiology: Theory and Practice in Health and Disease. 1st ed. Vols. 1, 2, and 3. Pergamon Press, New York. 1785 p.